splot.mapping.vba_choropleth
-
splot.mapping.vba_choropleth(x_var, y_var, gdf, cmap='GnBu', divergent=False, revert_alpha=False, alpha_mapclassify=None, rgb_mapclassify=None, ax=None, legend=False)[source]¶ Value by Alpha Choropleth
- Parameters
- x_varstring or array
The name of variable in gdf determined by color or an array of values determined by color.
- y_varstring or array
The name of variable in gdf determining alpha value or an array of values determined by color.
- gdfgeopandas dataframe instance
The Dataframe containing information to plot.
- cmapstr or list of str
Matplotlib Colormap or list of colors used to create vba_layer
- divergentbool, optional
Creates a divergent alpha array with high values at the extremes and low, transparent values in the middle of the input values.
- revert_alphabool, optional
If True, high y values will have a low alpha and low values will be transparent. Default = False.
- alpha_mapclassifydict
Keywords used for binning input values and classifying alpha values with mapclassify. Note: valid keywords are eg. dict(classifier=’quantiles’, k=5, hinge=1.5). For other options check splot.mapping.mapclassify_bin.
- rgb_mapclassifydict
Keywords used for binning input values and classifying rgb values with mapclassify. Note: valid keywords are eg.g dict(classifier=’quantiles’, k=5, hinge=1.5).For other options check splot.mapping.mapclassify_bin.
- axmatplotlib Axes instance, optional
Axes in which to plot the figure in multiple Axes layout. Default = None
- legendbool, optional
Adds a legend. Note: currently only available if data is classified, hence if alpha_mapclassify and rgb_mapclassify are used.
- Returns
- figmatplotlip Figure instance
Figure of Value by Alpha choropleth
- axmatplotlib Axes instance
Axes in which the figure is plotted
Examples
Imports
>>> from libpysal import examples
>>> import geopandas as gpd
>>> import matplotlib.pyplot as plt
>>> import matplotlib
>>> import numpy as np
>>> from splot.mapping import vba_choropleth
Load Example Data
>>> link_to_data = examples.get_path('columbus.shp')
>>> gdf = gpd.read_file(link_to_data)
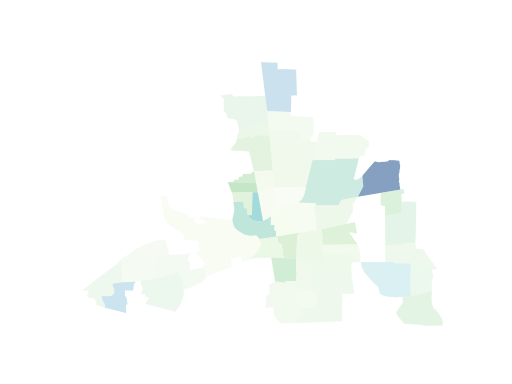
Plot a Value-by-Alpha map
>>> fig, _ = vba_choropleth('HOVAL', 'CRIME', gdf)
>>> plt.show()
(Source code, png, hires.png, pdf)
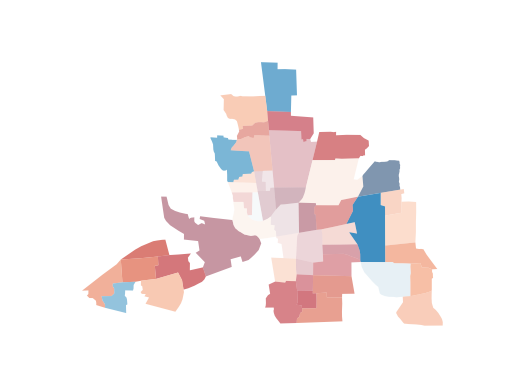
Plot a Value-by-Alpha map with reverted alpha values
>>> fig, _ = vba_choropleth('HOVAL', 'CRIME', gdf, cmap='RdBu',
...                         revert_alpha=True)
>>> plt.show()
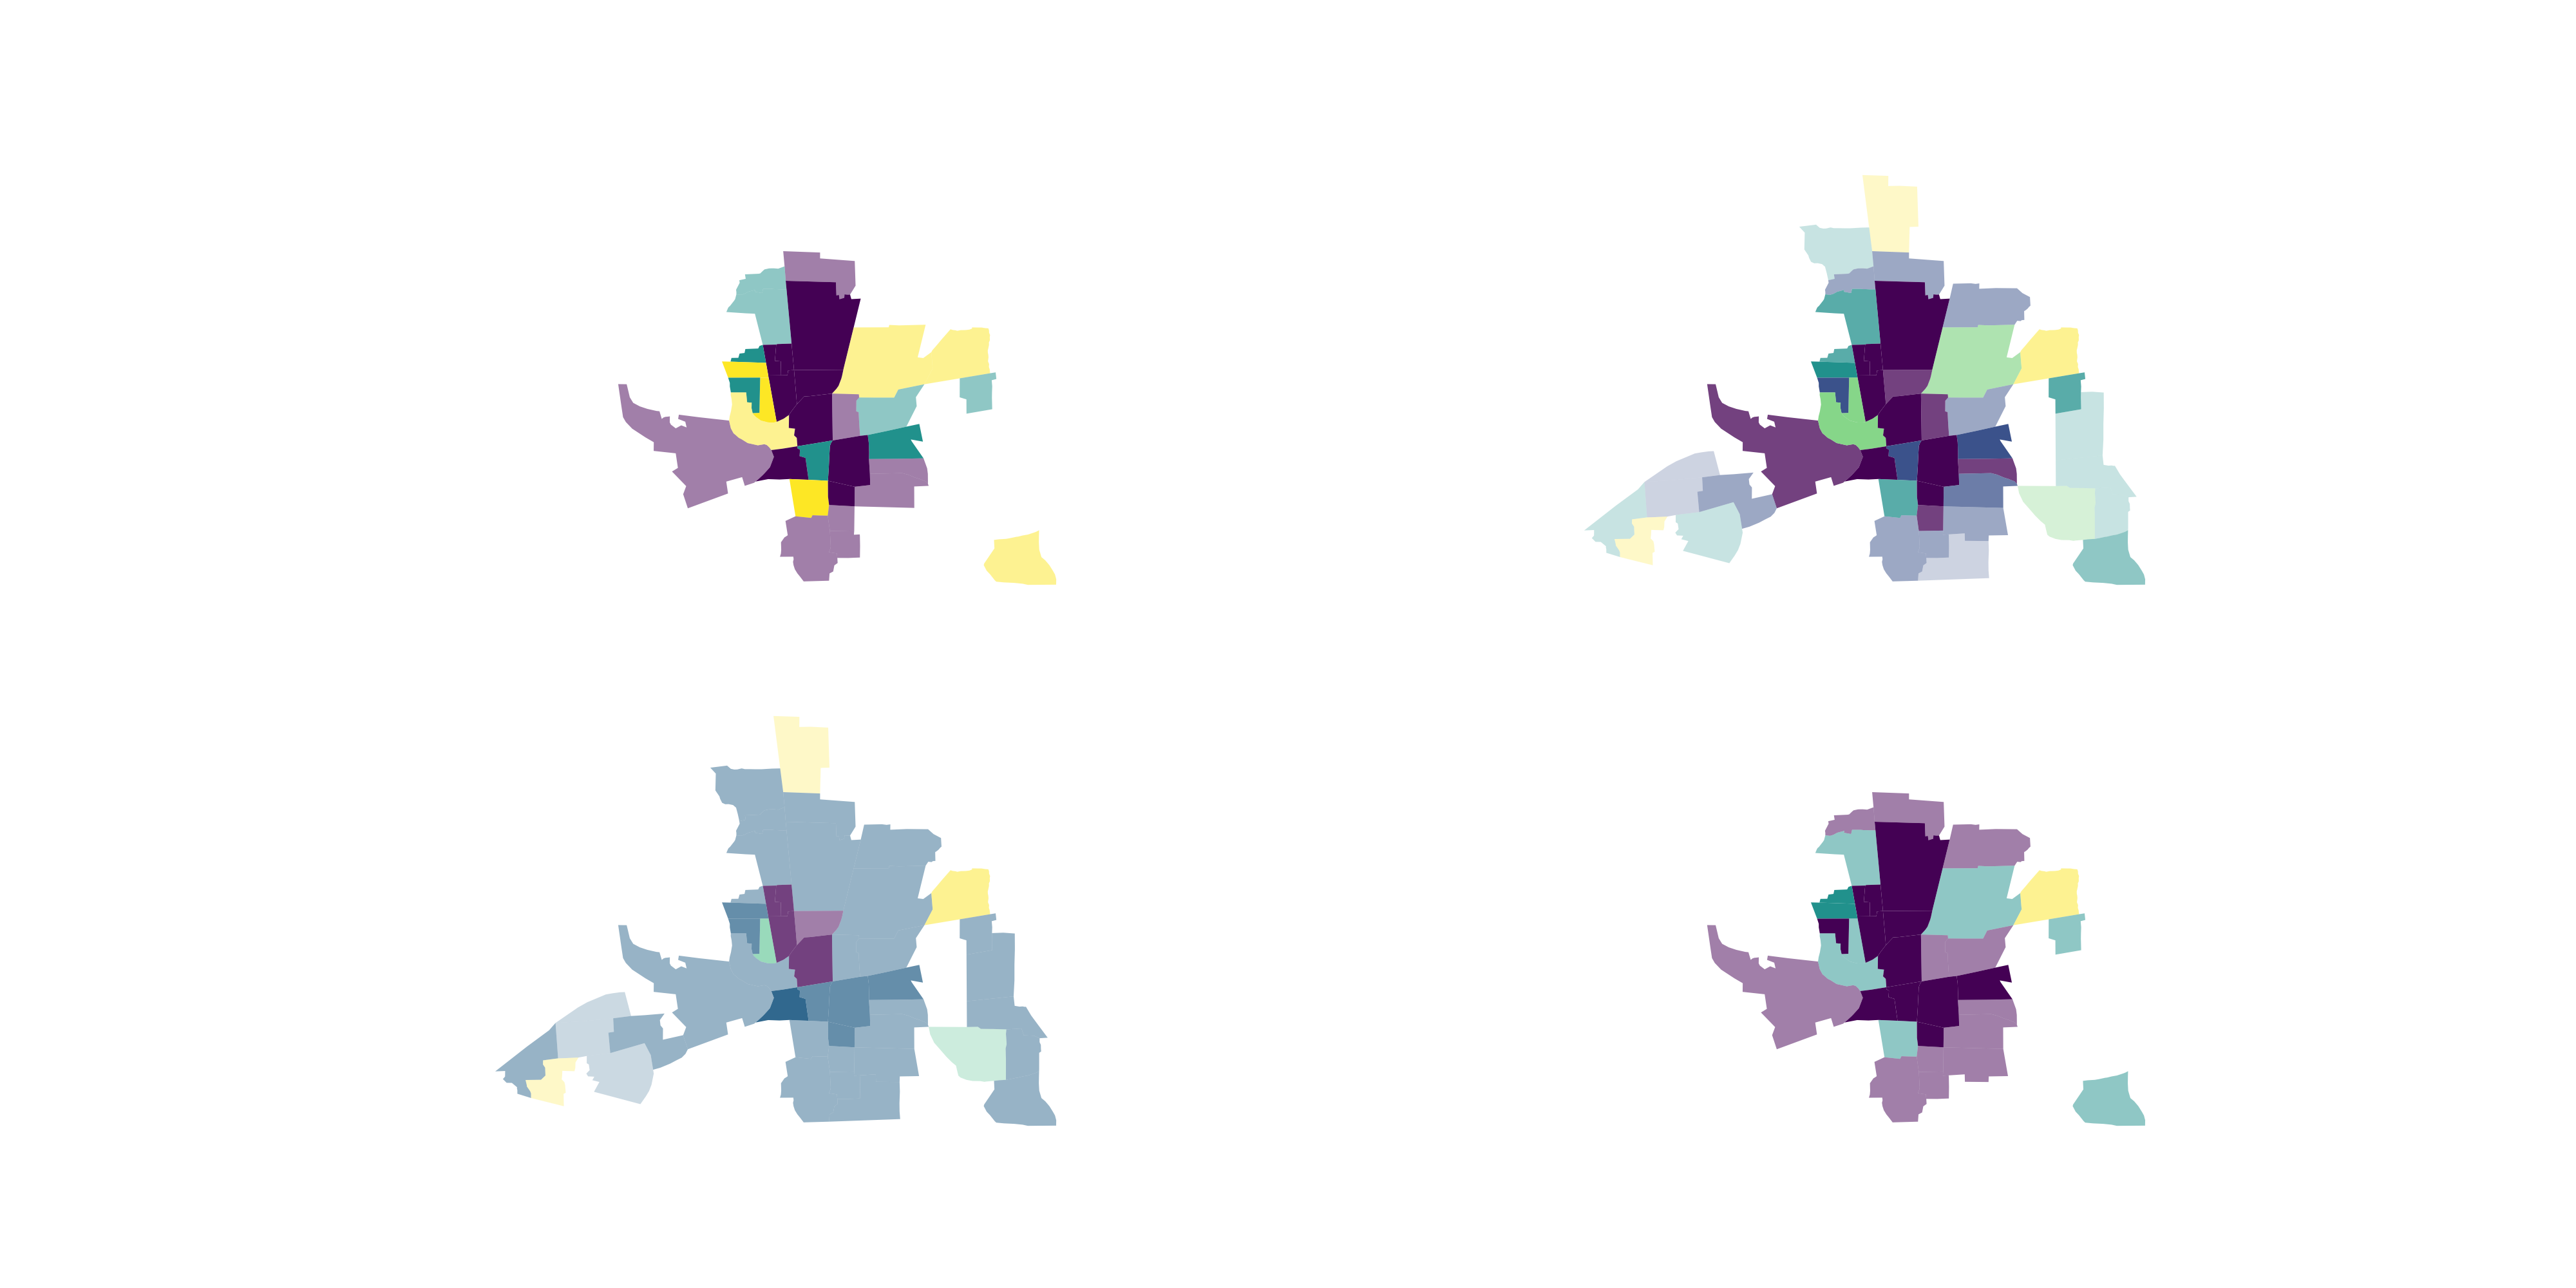
Plot a Value-by-Alpha map with classified alpha and rgb values
>>> fig, axs = plt.subplots(2,2, figsize=(20,10))
>>> vba_choropleth('HOVAL', 'CRIME', gdf, cmap='viridis', ax = axs[0,0],
...                rgb_mapclassify=dict(classifier='quantiles', k=3),
...                alpha_mapclassify=dict(classifier='quantiles', k=3))
>>> vba_choropleth('HOVAL', 'CRIME', gdf, cmap='viridis', ax = axs[0,1],
...                rgb_mapclassify=dict(classifier='natural_breaks'),
...                alpha_mapclassify=dict(classifier='natural_breaks'))
>>> vba_choropleth('HOVAL', 'CRIME', gdf, cmap='viridis', ax = axs[1,0],
...                rgb_mapclassify=dict(classifier='std_mean'),
...                alpha_mapclassify=dict(classifier='std_mean'))
>>> vba_choropleth('HOVAL', 'CRIME', gdf, cmap='viridis', ax = axs[1,1],
...                rgb_mapclassify=dict(classifier='fisher_jenks', k=3),
...                alpha_mapclassify=dict(classifier='fisher_jenks', k=3))
>>> plt.show()

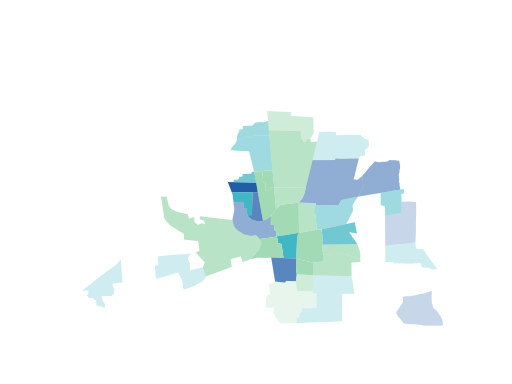
Pass in a list of colors instead of a cmap
>>> color_list = ['#a1dab4','#41b6c4','#225ea8']
>>> vba_choropleth('HOVAL', 'CRIME', gdf, cmap=color_list,
...                rgb_mapclassify=dict(classifier='quantiles', k=3),
...                alpha_mapclassify=dict(classifier='quantiles'))
>>> plt.show()
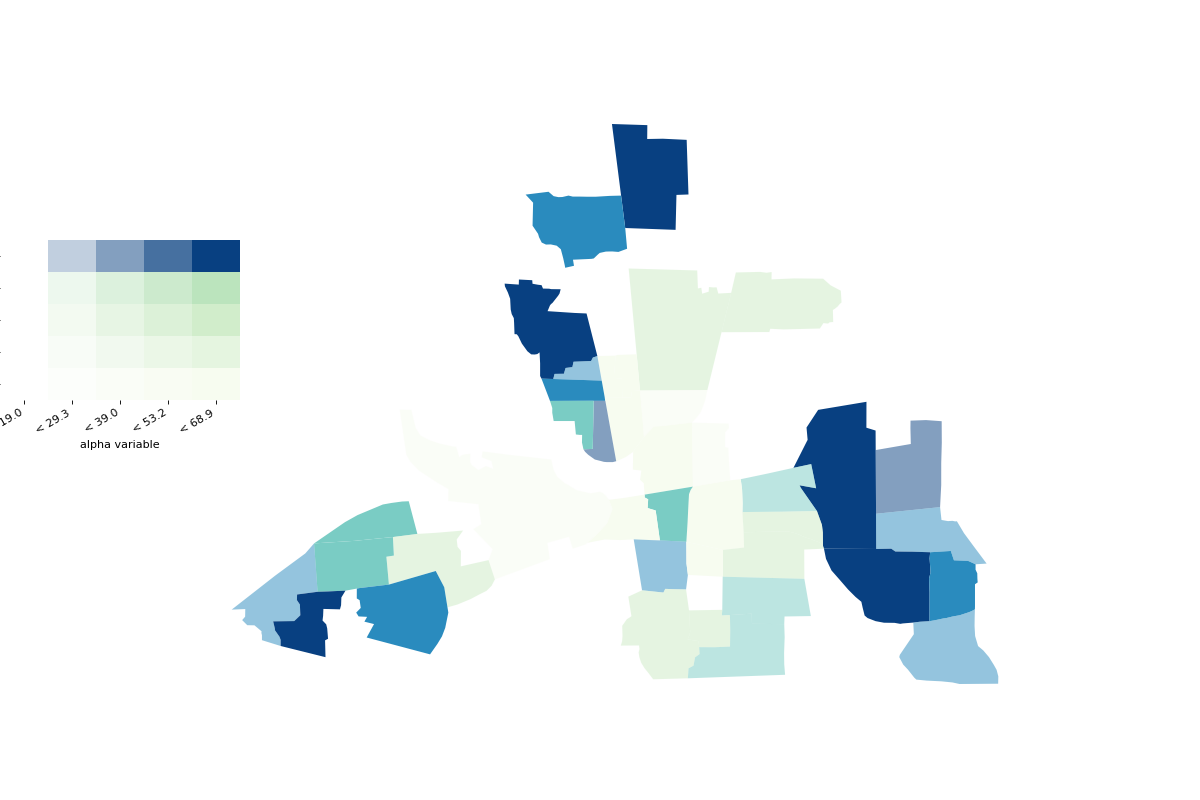
Add a legend and use divergent alpha values
>>> fig = plt.figure(figsize=(15,10))
>>> ax = fig.add_subplot(111)
>>> vba_choropleth('HOVAL', 'CRIME', gdf, divergent=True,
...                alpha_mapclassify=dict(classifier='quantiles', k=5),
...                rgb_mapclassify=dict(classifier='quantiles', k=5),
...                legend=True, ax=ax)
>>> plt.show()
